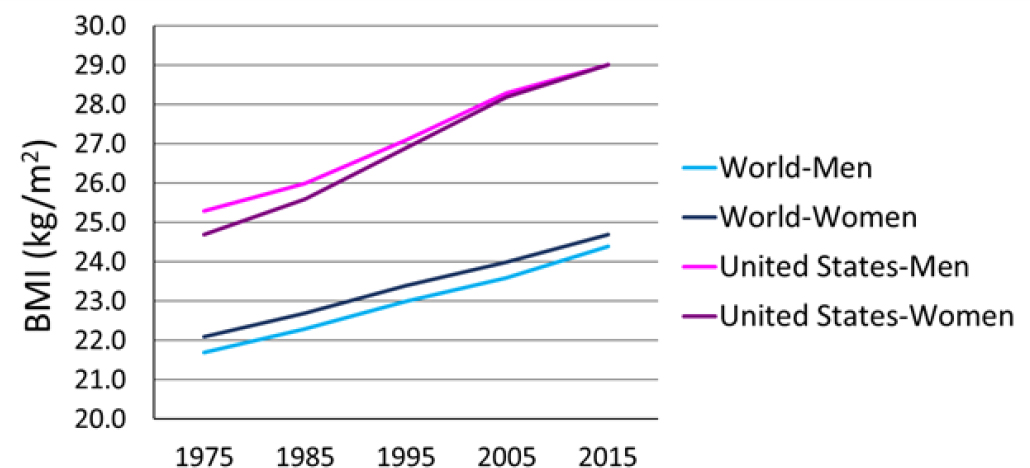
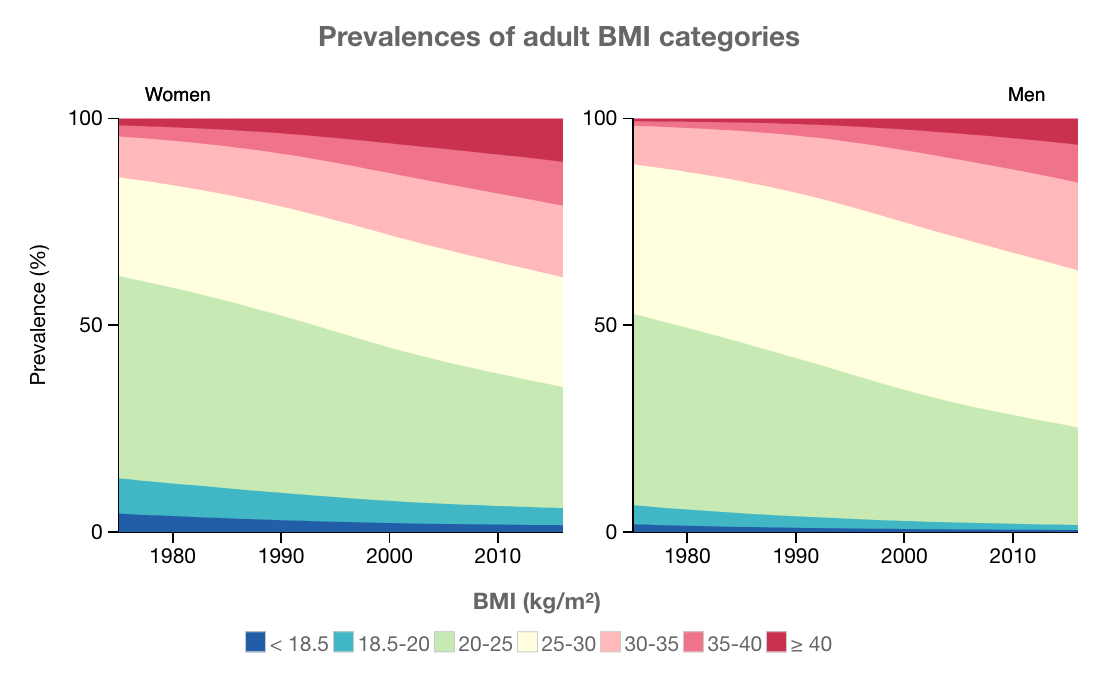
Underweight: BMI < 18.5
Normal: 18.5 ≤ BMI < 25
Overweight: 25 ≤ BMI < 30
Obese: BMI is 30 or higher
Prevalence in USA in 2017? CDC: Adult Obesity Facts explains,
Prevalence of obesity was 42.4% in 2017-2018. Prevalence of severe obesity was 9.2%.

Source: Current Status and Response to the Global Obesity Pandemic, Proceedings of a Workshop by National Academies of Science, Engineering & Medicine — in Brief, Jan 2019 — workshop details.
Projected U.S. State-Level Prevalence of Adult Obesity and Severe Obesity by Ward et al, NEJM (N Engl J Med) 2019; 381:2440-2450 estimates:
By 2030,
- Nearly 1 in 2 adults in USA (49%) will have obesity.
- The prevalence will be higher than 50% in 29 states and not below 35% in any state in USA.
- Nearly 1 in 4 adults is projected to have severe obesity; the prevalence will be higher than 25% in 25 states in USA.
- Nationally (in USA), severe obesity is likely to become the most common BMI category among women (28%), non-Hispanic black adults (32%) and low-income adults (32%).
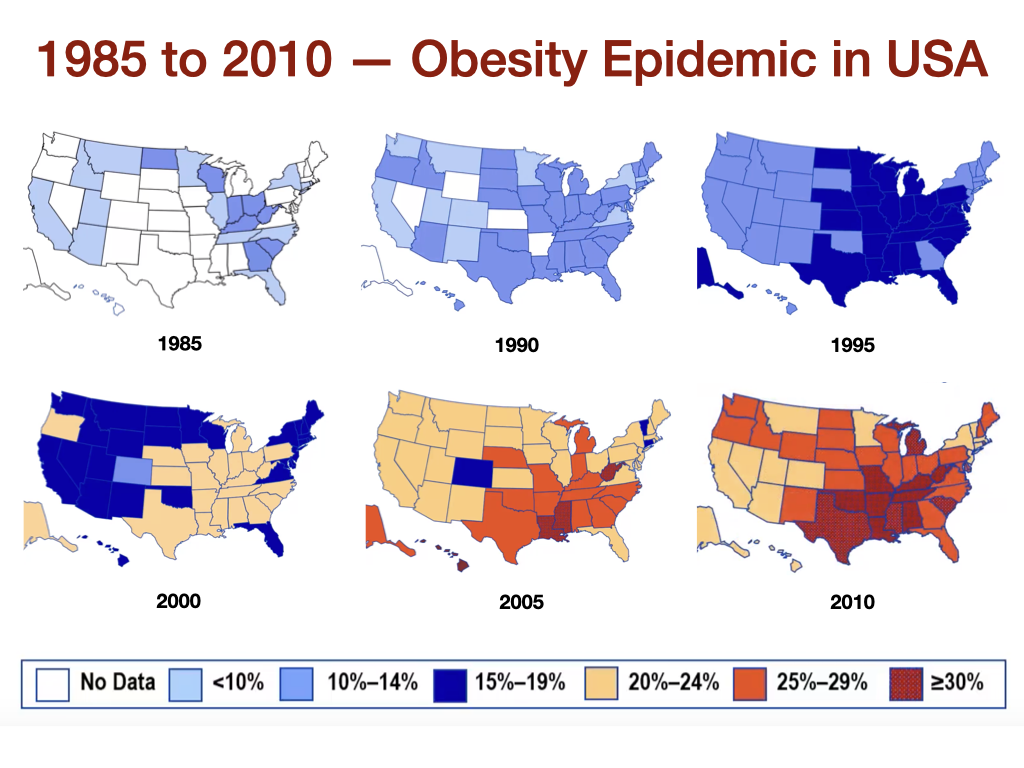
CDC has published Obesity Prevalence Maps with lots of stats.
An insightful video showing how obesity have risen across different US states from 1985 to 2016.
What's causing the obesity epidemic? CDC explains that obesity is a complex problem: our 'food environment' has changed and our culture has changed.

 Instagram
 YouTube
